See exactly what a Phase 0 Carbon Opportunity Map produces.
Representative sample outputs show what an airport is actually buying: carbon recycling maps, stream classification tables, pathway scoring, vendor matrices, claims boundaries, pilot roadmaps, and executive-ready decisions.
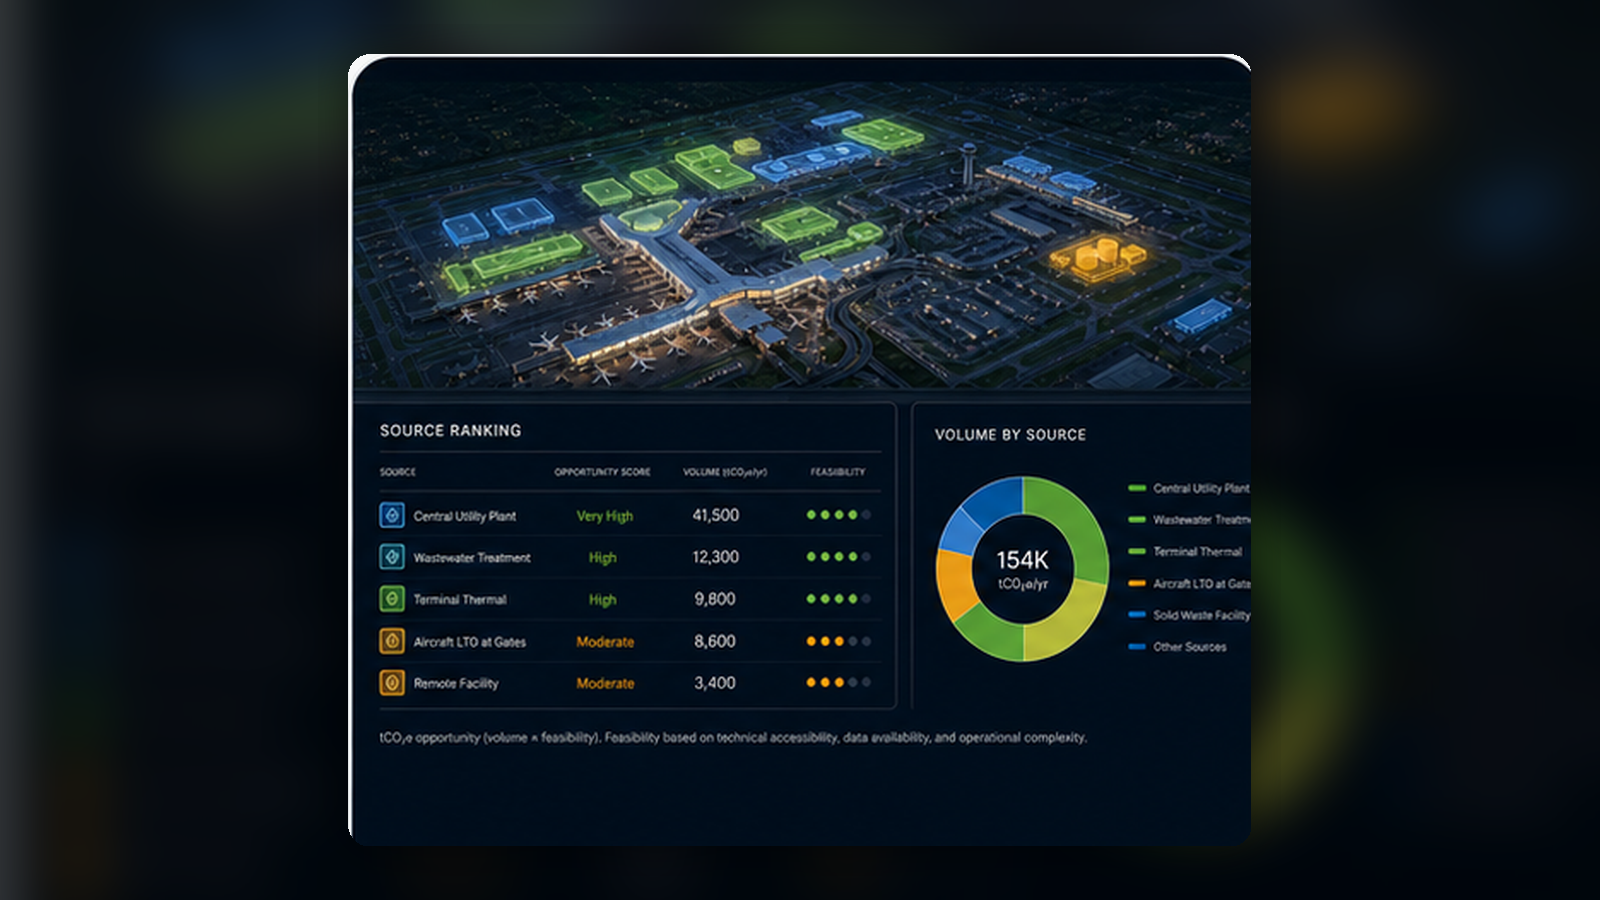
Illustrative only. Final outputs are customized to each airport.
Carbon Resource Map
Facility-by-facility mapping of terminal airflow, boilers, CHP, central plants, tenant assets, food waste, used cooking oil, mixed waste, wastewater, cargo zones, and regional sources.
Stream Classification Table
| Stream | Type | Route | Priority |
|---|---|---|---|
| Used cooking oil | Biogenic liquid | HEFA | 1 |
| Boiler exhaust | Fossil CO₂ | Capture | 2 |
| Mixed waste | Mixed solid | Sort / screen | 3 |
Vendor Fit Matrix
Matches stream types to vendor categories: capture, HVAC, waste recovery, AD, gasification, HEFA feedstock, SAF/e-fuels, hydrogen, storage, MRV, EPC, utilization, carbon buyers, and finance.
Claims Boundary Matrix
Separates emissions reduction, energy savings, waste diversion, carbon recycling, utilization, durable storage, and potential carbon removal.
Pilot Roadmap
Defines a staged pathway from lowest-risk stream to multi-source airport carbon recycling node.
- Resource inventory
- Stream activation
- Routing/offtake
- Regional corridor
Executive Briefing
Decision-ready summary for airport authority, airline, capital, legal, waste, facilities, tenant, and sustainability stakeholders.
Request a briefing →Request a Phase 0 Carbon Opportunity Map before selecting hardware or pathways.
Carbon Recycling can structure Phase 0 for a single airport, airline hub, airport authority, multi-airport operator, or regional aviation infrastructure network.